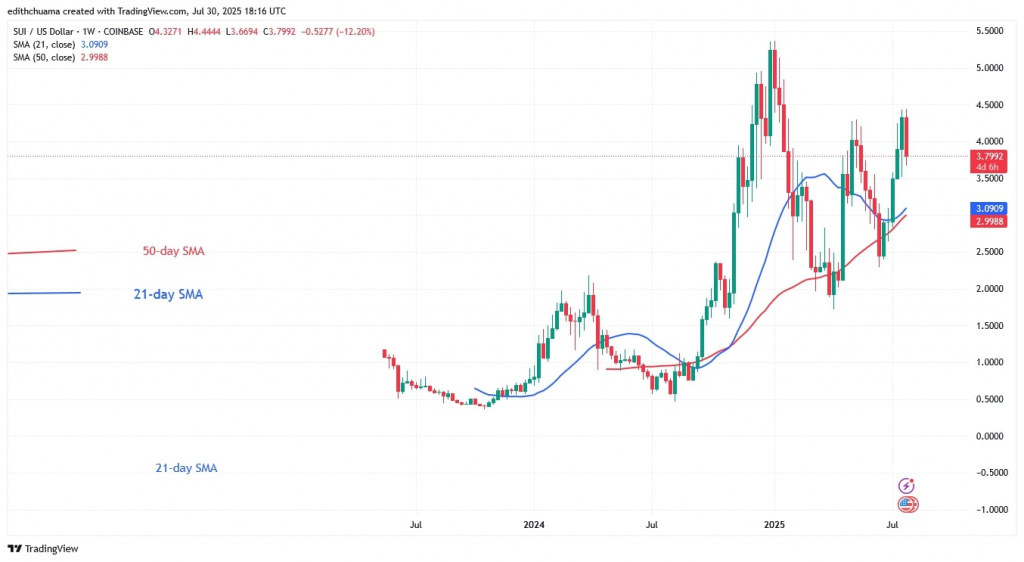
The price of Sui (SUI) has been trading above the moving average lines but below the $4.00 level.
Sui price long term forecast: bullish
The bulls were able to sustain their momentum above $4.00 but were beaten back. The upward movement was slowed by resistance at $4.50. Should the bulls break through the $4.50 barrier, SUI will return to its previous high of $5.37.
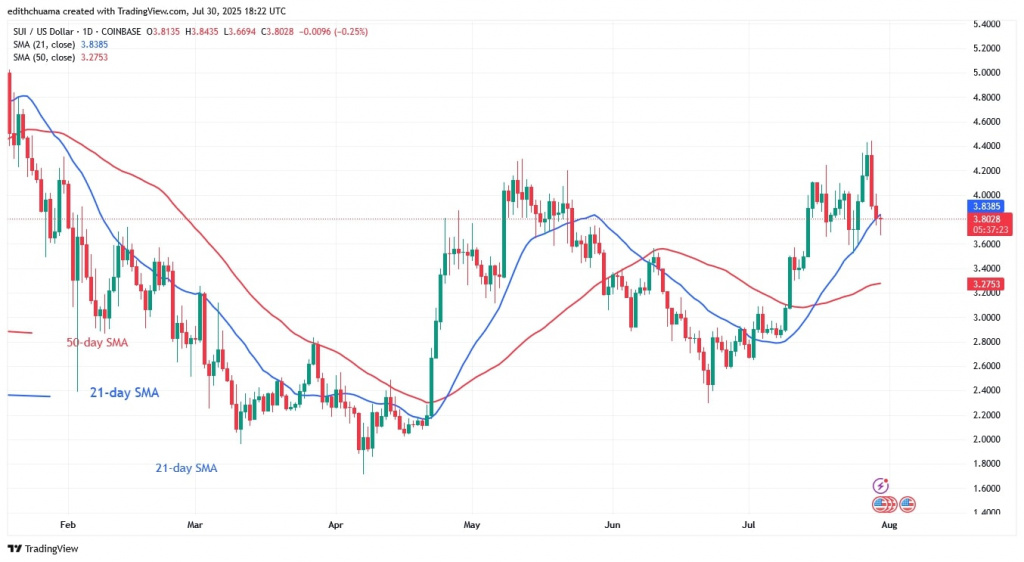
On the daily chart, SUI is on the decline after breaking below the 21-day SMA. The decline is expected to reach the 50-day SMA low at $3.27. Meanwhile, SUI’s value is at $3.72 and falling steadily.
Technical indicators
Key supply zones: $4.00, $4.20,$4.40
Key demand zones: $3.00, $2.80, $2.60
Analysing the SUI price indicators
On the daily chart, SUI is caught between the moving average lines. The price will have to move below the 21-day SMA barrier and above the 50-day SMA support to enter a trading range. The moving average lines are sloping upwards, indicating an uptrend.

What is the next move for Sui?
The price of SUI has fallen after reaching the $4.00 threshold. The altcoin is now trading between $3.20 and $4.00. If the current support is broken, the altcoin will go into a negative trend. In the meantime, the altcoin is falling and remains range-bound.

The price of Sui was in a sideways trend and stayed below the $4.00 resistance level, as Coinidol.com wrote last week.
Disclaimer. This analysis and forecast are the personal opinions of the author. They are not a recommendation to buy or sell cryptocurrency and should not be viewed as an endorsement by CoinIdol.com. Readers should do their research before investing in funds.


