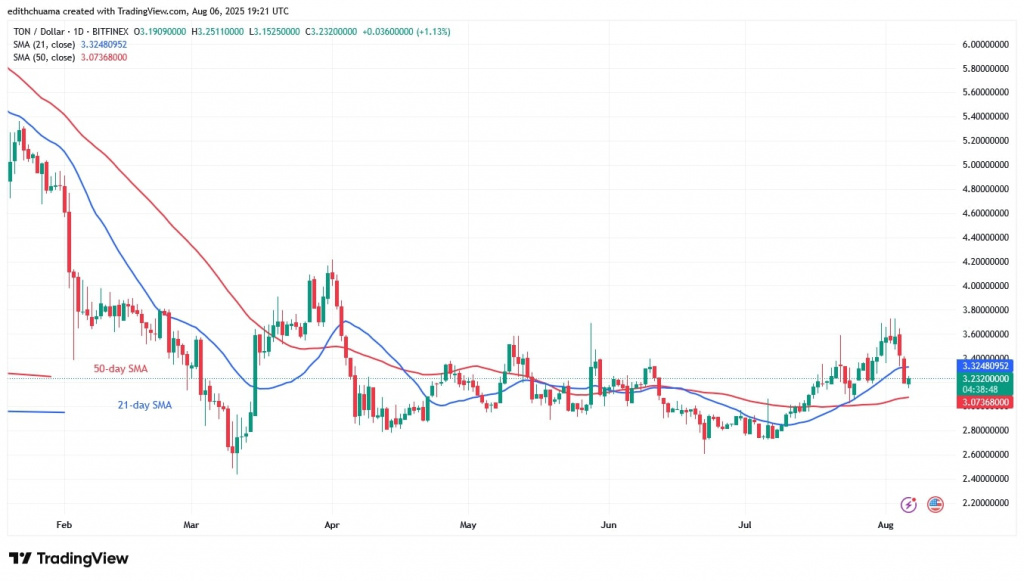
Toncoin (TON) continues to be in a horizontal trend that is weakening after reaching the $3.60 overhead barrier.
Toncoin price long-term prediction: bearish
Since April, buyers have struggled to keep the price above the $3.60 resistance, as Coinidol.com wrote. For months, the cryptocurrency traded above the $2.60 support and below the $3.60 resistance.
Today, the price of the cryptocurrency has fallen between the moving average lines. The fall between the moving average lines reinforces the cryptocurrency’s rangebound movement. Currently, the price of the cryptocurrency is trapped between the moving average lines. TON is currently worth $3.23.
TON price indicators analysis
The crypto price is trading between the 50-day and 21-day SMA, with the 50-day SMA acting as support. TON will resume its uptrend once it breaks above the 21-day SMA barrier. Similarly, TON would fall further if it breaks below the 50-day SMA as support. A break above the $3.60 barrier is unlikely due to the extended candlestick wicks above the overhead resistance. This suggests strong selling pressure at the recent top.
Technical Indicators
Key Resistance Zones: $4.00, $4.50, and $5.00
Key Support Zones: $3.50, $3.00, and $2.50

What’s the next move for Toncoin?
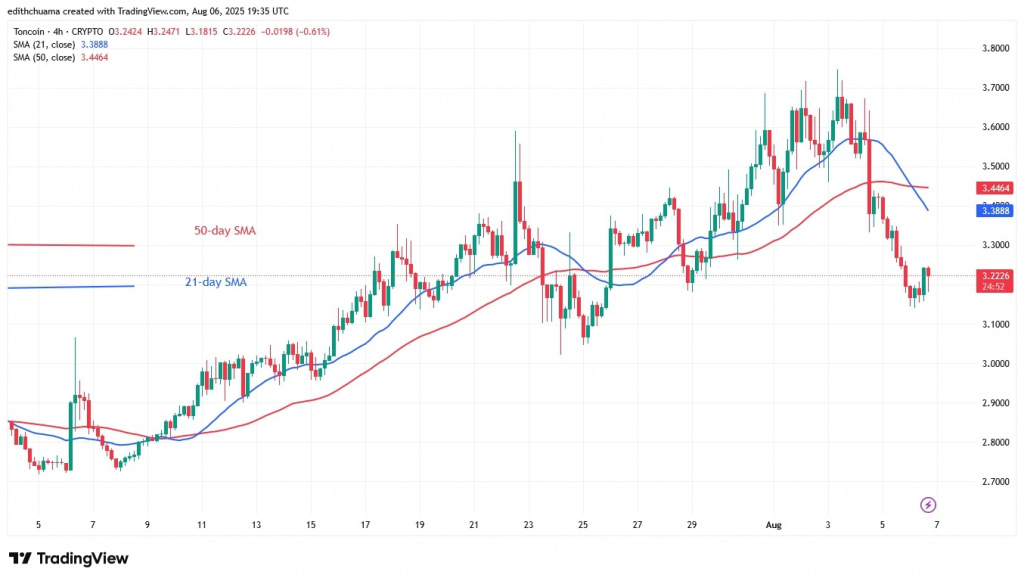
has returned to its trading range of $2.60 to $3.60. On the 4-hour chart, TON has fallen below the moving average lines but has found support above the $3.10 low.
The price of the cryptocurrency is expected to fluctuate above the current support and below the moving average lines. Currently, the upward movement has stalled in the middle of the price range.

On August 1, the price of the cryptocurrency rose to a high of $3.60 before falling, as reported.
Disclaimer. This analysis and forecast are the personal opinions of the author. They are not a recommendation to buy or sell cryptocurrency and should not be viewed as an endorsement by CoinIdol.com. Readers should do their research before investing in funds.


