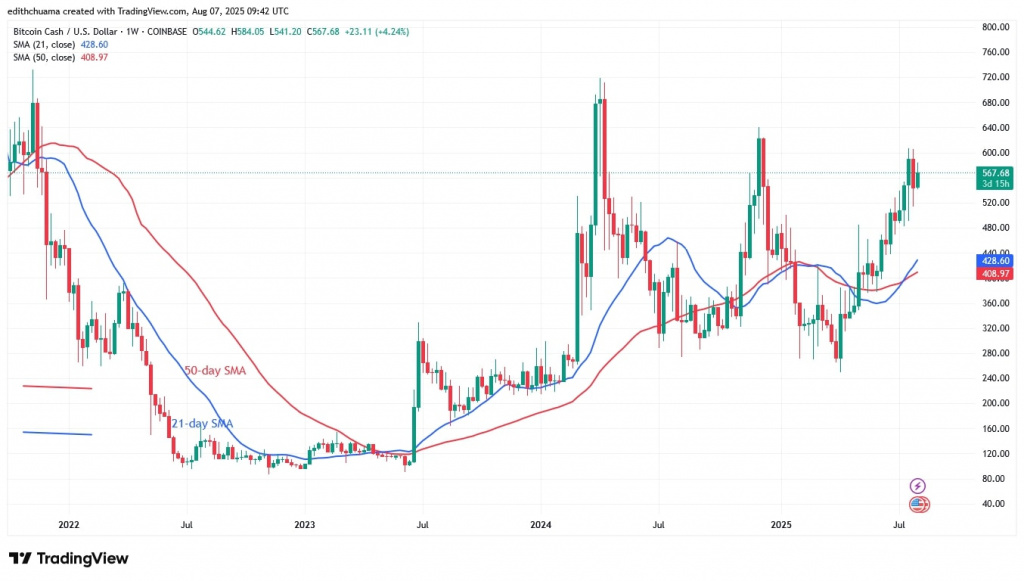
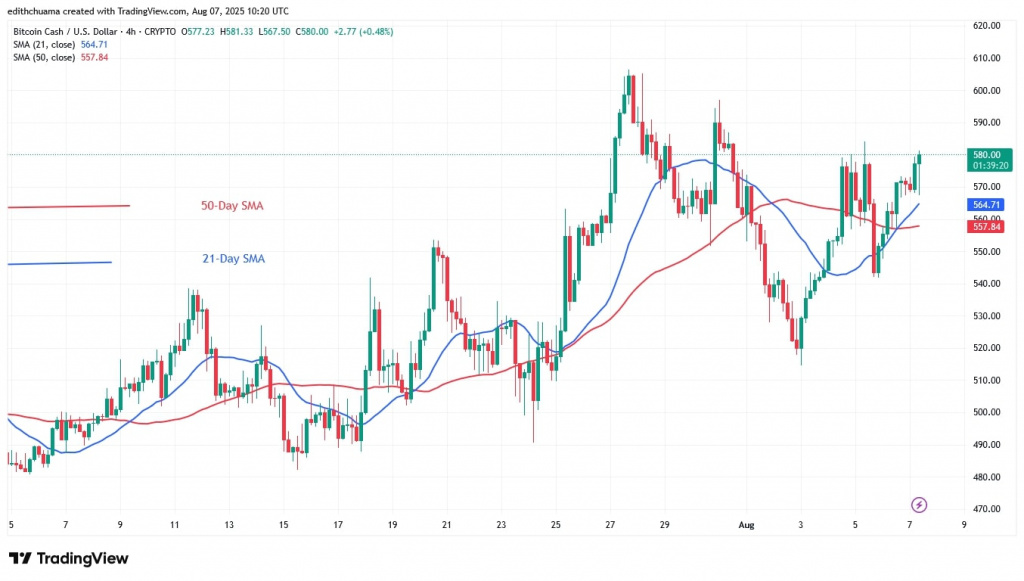
Bitcoin Cash (BCH) has recovered above the 21-day SMA support and resumed its uptrend.
Bitcoin Cash price long-term analysis: bullish
On July 27, the cryptocurrency climbed to a high of $607 before being rejected. The bulls bought the dips after the altcoin hit a low of $517.
Today, BCH has reached a high of $577. If the buyers keep the price above $600, the altcoin will rise to a high of $698. If BCH fails to break through the $600 mark, it will be forced to trade sideways. The altcoin is currently valued at $580.47.
Bitcoin Cash indicator reading
The price bars are higher than the upward sloping average lines. In both charts, the 21-day SMA is above the 50-day SMA, indicating an uptrend. The extended candlestick wicks that pierced the $600 level indicate strong selling pressure at the recent high. The moving average lines on the 4-hour chart are sloping horizontally due to the $600 level.
Technical Indicators
Key Resistance Zones: $600, $650, $700
Key Support Zones: $500, $450, $400

What is the next direction for BCH/USD?
BCH is trading sideways after the end of the upswing on July 27. The 4-hour chart shows that BCH is trading above the $520 support and below the $600 barrier. BCH is currently bearish after reaching the initial barrier of $590.
The sideways movement will continue if the altcoin retraces and stays above the moving average lines. Selling pressure will set in if the price falls below the moving average lines.

On July 18, as Coinidol.com wrote, buyers pushed the price above the 21-day SMA and it rose to a high of $553.
Disclaimer. This analysis and forecast are the personal opinions of the author. They are not a recommendation to buy or sell cryptocurrency and should not be viewed as an endorsement by CoinIdol.com. Readers should do their research before investing in funds.


