

Binance Coin (BNB) has risen above the moving average lines, continuing its uptrend.
BNB price long-term prediction: bearish
During the previous rally, the altcoin rose to a high of $861 before falling. The price fell to a low of $732 before the bulls bought the dips, as reported previously by Coinidol.com. If the 21-day SMA holds, BNB will rally to its previous high of $861.
However, if the recent high is broken, the uptrend will continue to $1,100. Currently, the uptrend is hitting a first barrier near the $800 mark. If the altcoin declines and falls below the 21-day SMA support, BNB will fall back to the previous low of $700. BNB is currently valued at $786.
BNB price indicators analysis
After the current rally, the price has risen above the moving averages. It is predicted that BNB will gain in the bullish trend zone. On the 4-hour chart, the price bars are above the moving average lines, indicating that the altcoin is about to move higher. BNB’s moving average lines are currently pointing upwards due to the uptrend.
Technical indicators:
Key Resistance Levels – $800, $850, $900
Key Support Levels – $600, $550, $500
 - AUG.08, 2025")
What is the next direction for BNB/USD?
The BNB price has returned above the moving average lines, signalling the start of an upward trend. On the 4-hour chart, the altcoin is trading above the $740 support and below the $860 high. The upward trend has begun, but it meets an initial impediment near the $800 mark.
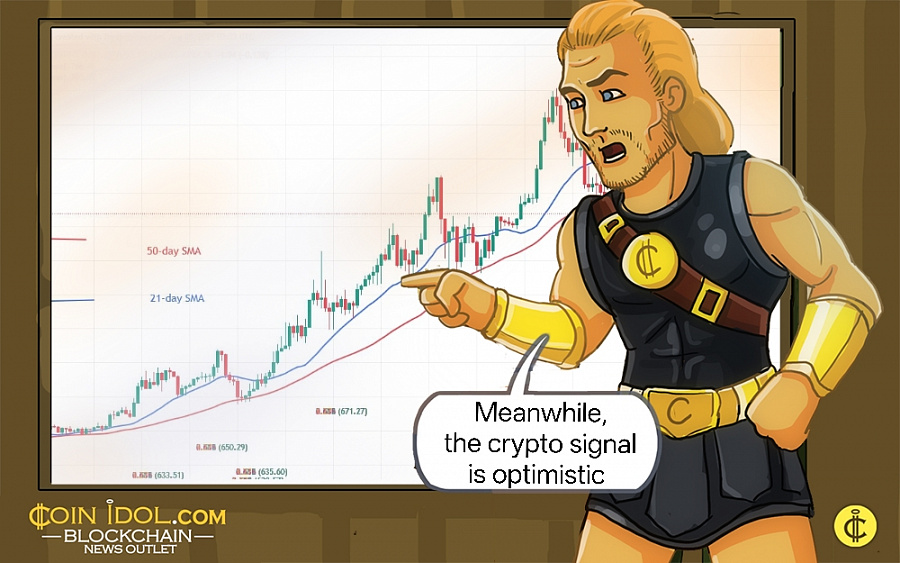
Meanwhile, the crypto signal is optimistic, with price bars returning above the moving average lines.
 - AUG.08, 2025")
Disclaimer. This analysis and forecast are the personal opinions of the author. They are not a recommendation to buy or sell cryptocurrency and should not be viewed as an endorsement by CoinIdol.com. Readers should do their research before investing in funds.


