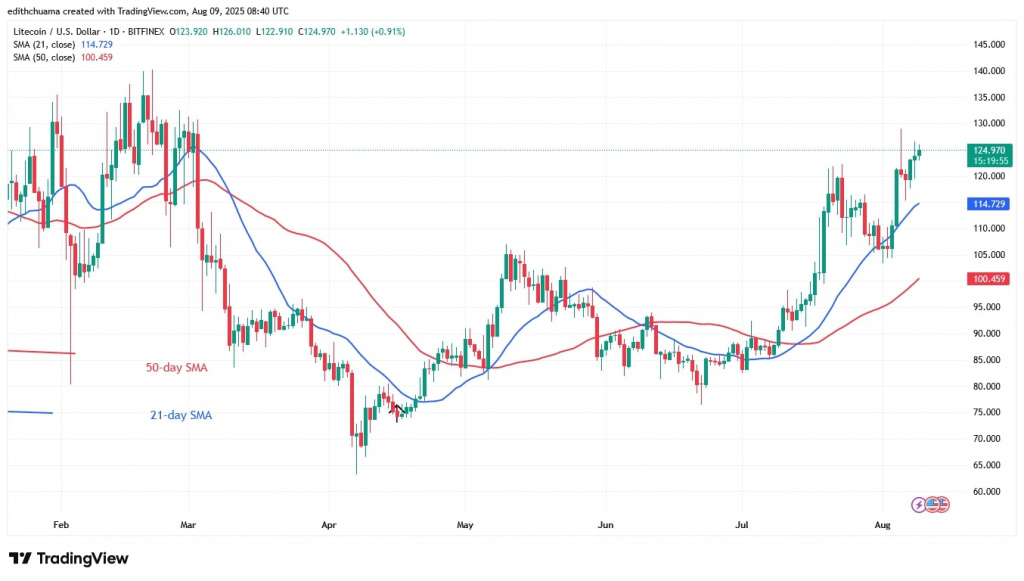
Litecoin (LTC) has recovered from its slide above the 21-day SMA support.
Litecoin price long-term prediction: bullish
The bears pushed the price below the 21-day SMA support but the bulls bought the dips at $103. The altcoin will rise if it reaches the $120 level. Since July 20, as reported by Coinidol.com, the altcoin has been above the 21-day SMA support but below the high of $120.
Today, the LTC price has broken through the $120 mark and continues to rise. If the positive momentum continues, Litecoin could reach the highs of $140 and $147.
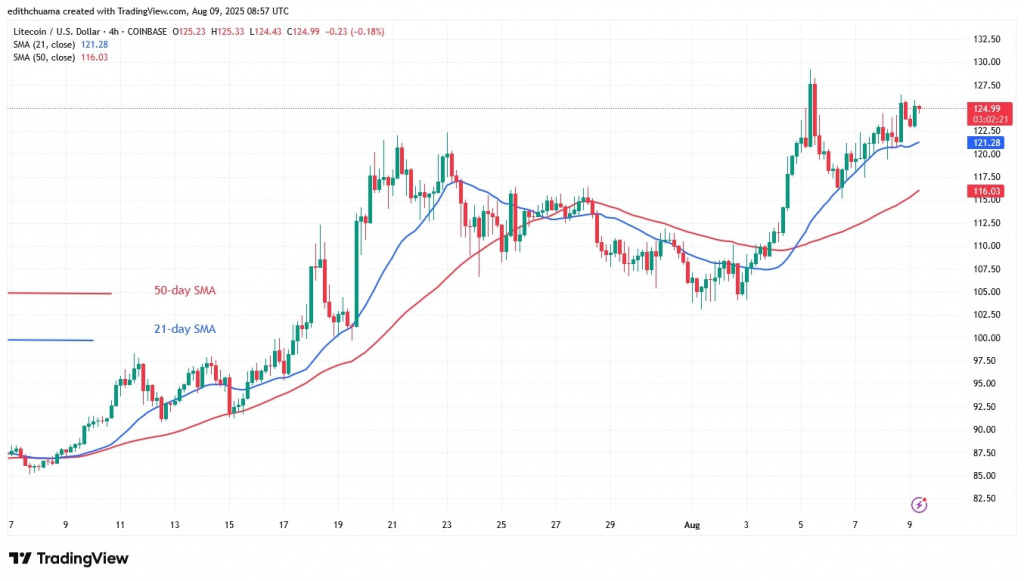
On the downside, selling pressure will set in once the price falls below the $120 breakout level. At the time of writing, Litecoin is trading at $125.
Analysing the Litecoin indicators
The LTC price continued its uptrend by rising above the 21-day SMA support. The price of the cryptocurrency has recovered above the 21-day SMA support, indicating that it will resume its uptrend.
On August 5, the long candlestick wicks signalled strong selling pressure at the $130 high. The moving average lines are sloping upwards, indicating the current trend.
Technical Indicators
Resistance Levels: $100, $120, $140
Support Levels: $60, $40, $20

What is the next move for Litecoin?
Litecoin is rising and approaching the next barrier of $130. In recent activity, the altcoin reached highs of $129 and $127 before being pushed back. Buyers are making their third attempt to push the price above the resistance levels. The uptrend hits a first resistance at the high of $127.

Disclaimer. This analysis and forecast are the personal opinions of the author. They are not a recommendation to buy or sell cryptocurrency and should not be viewed as an endorsement by CoinIdol.com. Readers should do their research before investing in funds.


