The price of Bitcoin (BTC) falls below the $120,000 mark after two weeks of sluggish movement.
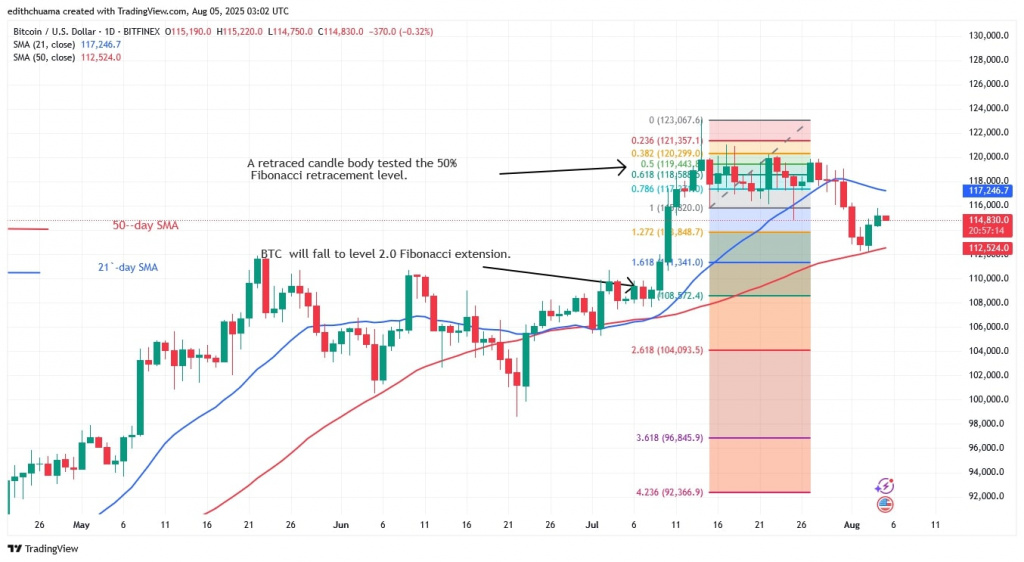
During the last rally, as Coinidol.com wrote, Bitcoin reached a high of $123,120 before heading back down. But on July 29, the bears broke through the critical 21-day SMA support, putting an end to the rally.
Bitcoin price long-term prediction: bearish
The largest cryptocurrency fell below the moving average lines but eventually held above the 50-day SMA. Despite its decline, Bitcoin remained between the 50-day SMA support and the 21-day SMA barrier. Once Bitcoin breaks through the 21-day SMA, it will resume its uptrend. The Bitcoin price will then rise again to $123,120, its previous high.
However, the price indicator predicts that Bitcoin will fall even further. If the bears break the 50-day SMA support, the BTC price will fall to the 2.0 Fibonacci extension or $108,572.40. Bitcoin is currently worth $114,500.
Analysing the BTC price indicators
Bitcoin price is falling, but is trapped between the 21-day SMA barrier and the 50-day SMA support. The Bitcoin price fluctuates between the moving average lines. Bitcoin will come under selling pressure again if it falls below the 50-day SMA support. On the other hand, Bitcoin will rise as soon as it breaks above the 21-day SMA.
Technical indicators
Key supply zones: $110,000, $115,000, $120,000
Key demand zones: $100,000, $95,000, $90,000

What is the next move for Bitcoin?
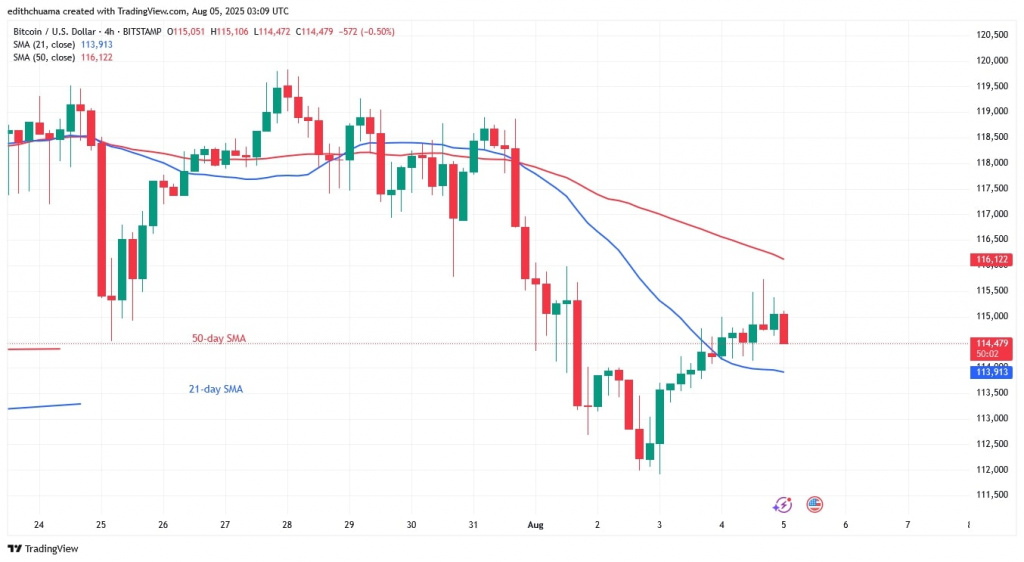
On the 4-hour chart, Bitcoin is falling below the moving average lines. The cryptocurrency is trading above the support level of $112,000 but below the moving average lines or resistance at $116,000. If the current support level of $112,000 is broken, the price of Bitcoin will fall.

Disclaimer. This analysis and forecast are the personal opinions of the author. They are not a recommendation to buy or sell cryptocurrency and should not be viewed as an endorsement by CoinIdol.com. Readers should do their research before investing in funds.


