

- Year-end equity outflows and the Bitcoin price pullback to $87K–$88K reflect profit-taking.
- The Fed’s $2.5B repo injection and record $22.3T M2 signal renewed liquidity, a backdrop that has historically favored Bitcoin.
- Gold-inferred models peg Bitcoin near $169K, suggesting significant upside if capital rotates as it has in past cycles.
The Federal Reserve just injected nearly $2.5 billion into markets through overnight repurchase agreements for Treasury securities on December 26, 2025, according to FRED data.
This spike stands out on the chart, where levels had stayed near zero for much of the past year before jumping to $2.501 billion. Such repo operations help manage short-term liquidity, often signaling year-end adjustments in the banking system.
THE FED JUST INJECTED $2.5B INTO THE U.S. BANKING SYSTEM VIA OVERNIGHT REPOS!
HERE WE GO! 🚀 pic.twitter.com/AvO0m2yf86
— That Martini Guy ₿ (@MartiniGuyYT) December 27, 2025
This Fed move comes as the money supply grows. U.S. M2 hit a record $22.3 trillion in November 2025, up 4.3% year-over-year.
The steady rise since the post-pandemic surge reflects ongoing liquidity expansion, with an average annual growth rate of around 6.3% since 2000. Expanding the money supply typically supports riskier assets, such as stocks and cryptocurrencies, over time, as it erodes the purchasing power of the dollar.
Meanwhile, the U.S. equities faced outflows last week, with institutions leading sales at -$5.5 billion—their first net selling in five weeks. Hedge funds bucked the trend, buying +$2.2 billion. Total outflows hit -$5.1 billion, driven by single stocks. This end-of-year cashing-in often sets up stronger starts to new years, as positions reset.
Bitcoin Price Faces Pullback Pressure
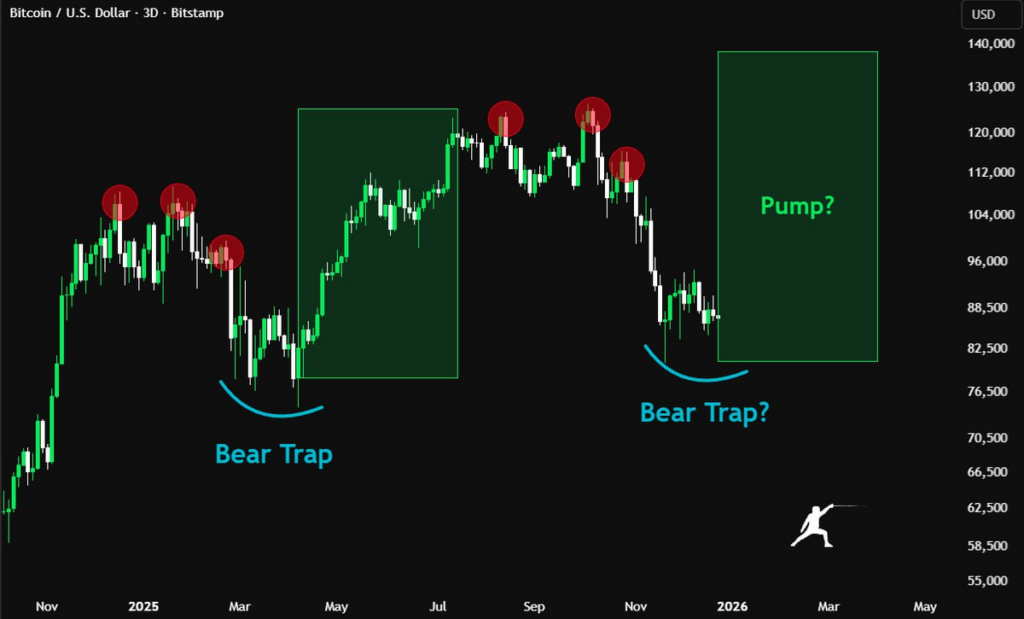
Bitcoin trades around $87,000–$88,000 as of late December 2025, down from recent highs above $100,000. The 12-month TradingView chart shows a sharp climb through 2025 before a correction, with price now testing lower ranges after failing to hold $100,000–$110,000.
On the daily/3D chart, it forms a potential “bear trap” pattern; earlier dips lured sellers, but rebounds followed. The current setup hints at a possible pump if shorts get squeezed toward $95,000, triggering billions in liquidations.
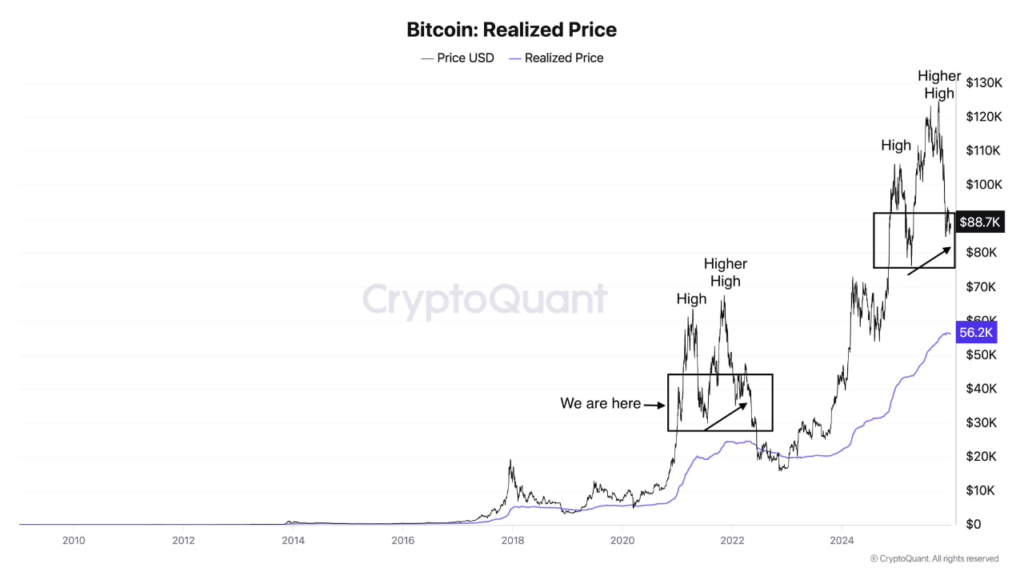
On-chain signals add caution as Bitcoin’s realized price sits near $56,000, acting as a historical gravity level during corrections. Price often retraces toward it after cycle highs, as seen in past bear phases. If momentum stays weak, a slide to $56,000–$70,000 could reset leverage before Bitcoin’s next leg up.
What’s more, the Bitcoin price appears undervalued against gold. The gold-inferred fair value suggests BTC should be trading around $169,000, nearly double current levels. Past cycles show Bitcoin rallying strongly when gold tops out, such as the 400% surge after gold peaked in August 2020.
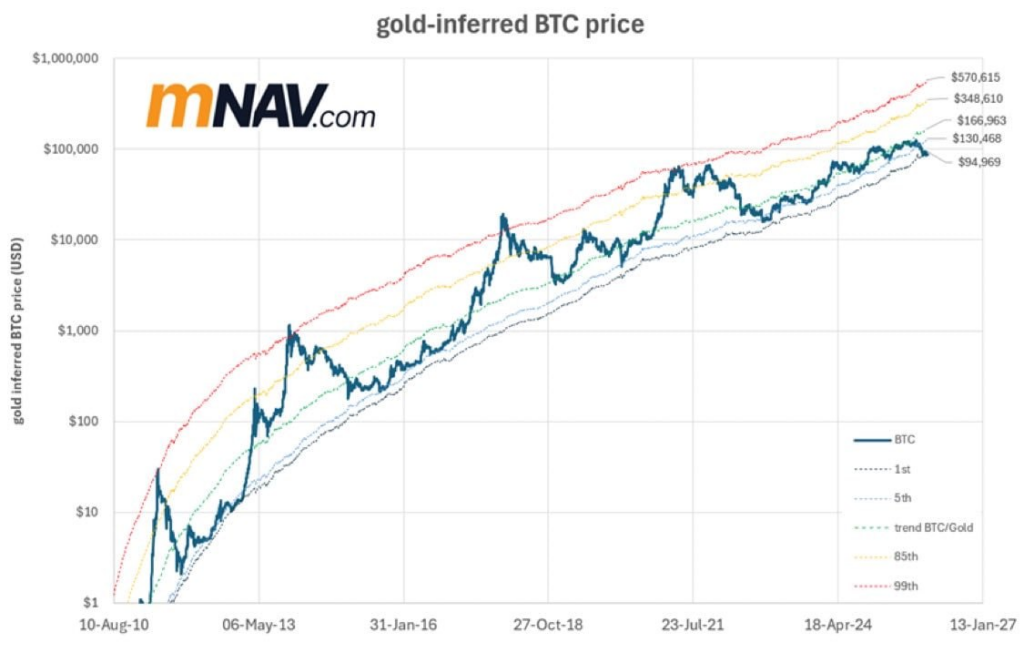
If similar patterns hold, Bitcoin could see parabolic gains in 2026 as capital rotates.
Year-end profit-taking and leverage resets create headwinds now, but Fed liquidity, record M2, and potential short squeezes point to upside.
The first red post-halving year ends in less than a week, historically a setup for rallies. While near-term caution prevails (watch realized price support), trillions in sidelined capital could flow into crypto if risk appetite returns, setting up a strong 2026.
What’s your Reaction?
+1
0

+1
0

+1
1

+1
0

+1
0

+1
0

+1
0


