

- Bitcoin is trading around $87,000–$88,000, sitting directly on a long-term trendline that has only been tested four times since 2013.
- The Crypto Fear & Greed Index has dropped to 19, deep in Extreme Fear territory, a zone that has historically coincided with accumulation phases.
- Bitcoin spot ETFs saw $348 million in net outflows on December 31, while new OECD crypto tax reporting rules came into force on January 1, 2026.
Bitcoin kicked off 2026 on a cautious note, trading around $87,500 as markets digested year-end volatility and fresh regulatory changes.
The flagship cryptocurrency hovered near key levels, with sentiment leaning heavily toward fear amid recent pullbacks from 2025 highs above $120,000.
Long-Term Trendline Holds Firm
A widely watched BTC/USDT chart highlights Bitcoin’s 12-year trendline support, a blue upward-sloping line connecting major lows since 2013. This macro support has acted as a floor during past downturns.
The chart shows Bitcoin touching this trendline only four times historically: in 2013, 2015, 2022, and now in 2025/early 2026. Each prior touch marked a cycle bottom, followed by strong recoveries. Arrows on the chart point to these bounces, where the price dipped to the line before rallying sharply higher.
Currently, Bitcoin sits right at this support around the $87,000–$88,000 zone after a correction.
The monthly candlestick chart displays a long-term uptrend with periodic pullbacks to the trendline, then explosive moves upward. This pattern suggests the current dip could be another accumulation phase rather than a breakdown, provided the line holds.
Extreme Fear Grips Market Sentiment
The Crypto Fear & Greed Index reads 19, deep in Extreme Fear territory. The gauge, shown on a dark-themed dashboard with a semicircle meter, places the needle firmly in the red “Extreme Fear” section. Historical data below the meter reveals the index has spent significant time in fear zones, often preceding rebounds.
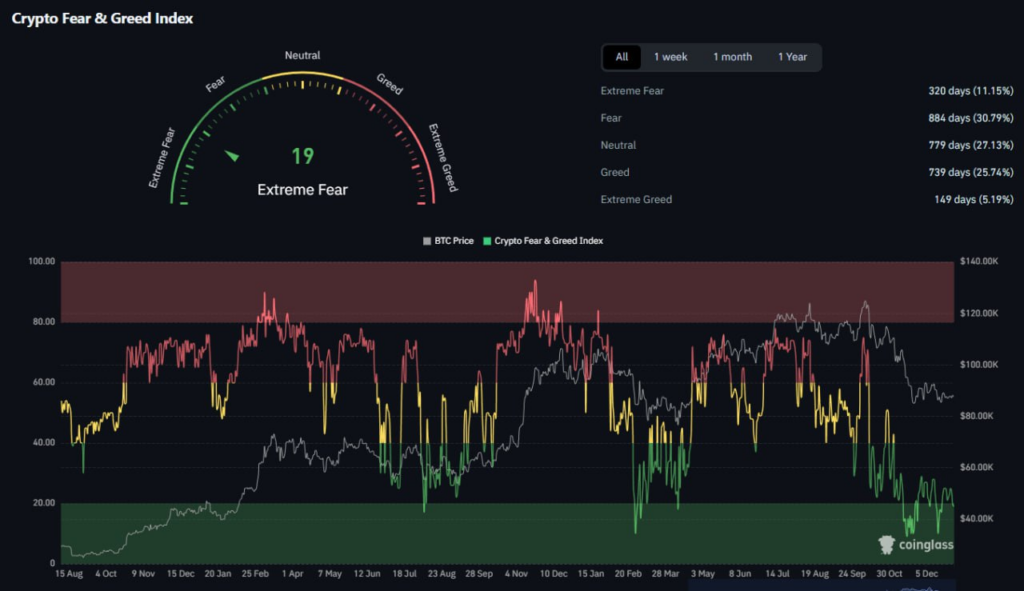
Such low readings, where fear dominates, have historically signaled buying opportunities. Investors appear overly pessimistic after late-2025 outflows and price consolidation, creating potential for a reversal if confidence returns.
ETF Outflows Add Pressure
On December 31, Bitcoin spot ETFs recorded a hefty net outflow of $348 million, with all 12 funds seeing zero inflows. This contributed to recent downward pressure, as shown in ETF flow trackers with red bars indicating outflows and declining total assets of around $113 billion.
While inflows had been strong earlier in 2025, holiday-period derisking and year-end positioning led to this pullback.
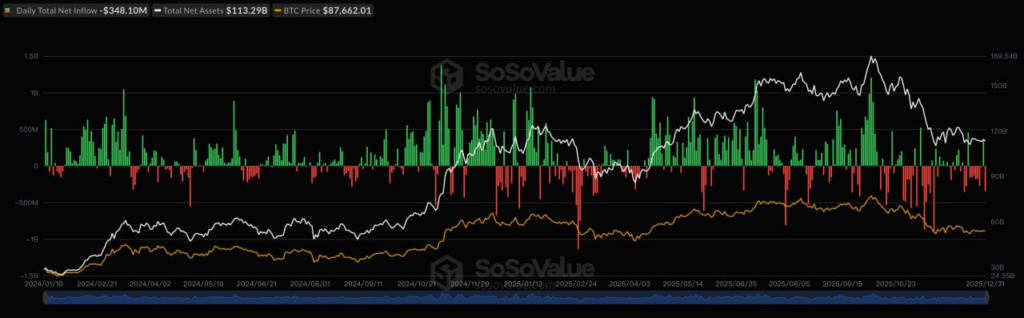
Ethereum ETFs saw $72 million in outflows, while smaller Solana and XRP ETFs posted modest inflows.
New Tax Rules Take Effect
As of January 1, 2026, the UK and over 40 countries implemented the OECD’s Cryptoasset Reporting Framework (CARF). Exchanges must now collect and report user transaction data to tax authorities like HMRC. This aims to boost transparency but may add short-term caution for some holders.
Overall, Bitcoin’s position at historic support, combined with extreme fear and recent outflows, paints a picture of a market in reset mode.
History shows these conditions often precede stronger moves, though volatility remains high in the new year. Investors are watching closely to see if this dip marks another cycle bottom.
What’s your Reaction?
+1
1

+1
0

+1
0

+1
0

+1
0

+1
0

+1
0


