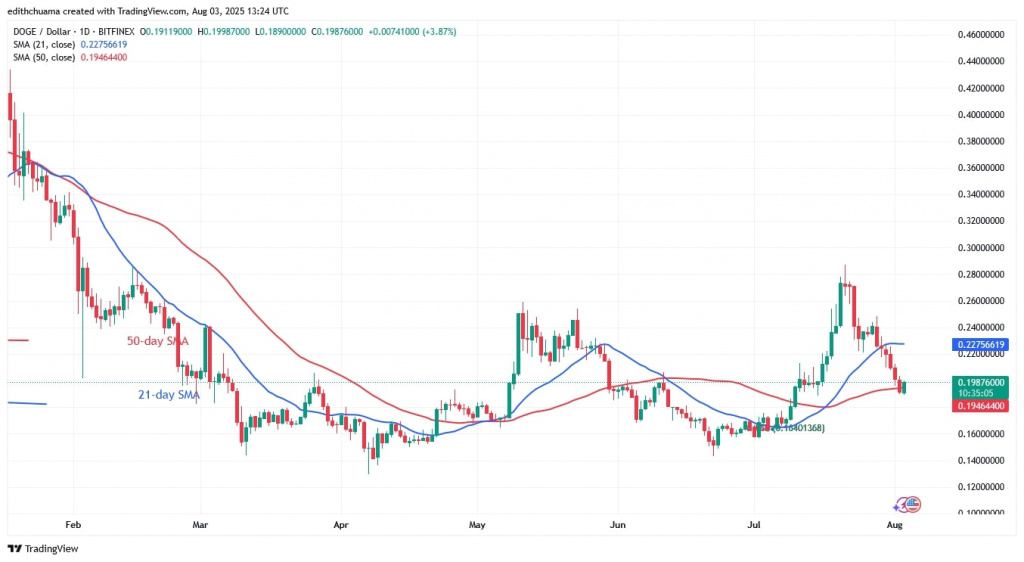
The price of Dogecoin (DOGE) has slipped below the moving average lines after hitting resistance at $0.287.
Dogecoin price long-term prediction: bearish
The cryptocurrency had previously rallied to a high of $0.287 but was unable to sustain the positive trend. The rejection prompted DOGE to return to its previous price range of $0.14 to $0.26.
Today, DOGE has dropped to a low of $0.189. The bulls bought the dips and are trying to push the altcoin above its 50-day SMA support. DOGE will hit a high of $0.22 if the buyers push the altcoin above the 50-day SMA support. The positive momentum will continue to the high of $0.26. However, if DOGE falls below the 50-day SMA, it will fall back to its previous low of $0.14.
DOGE price indicators analysis
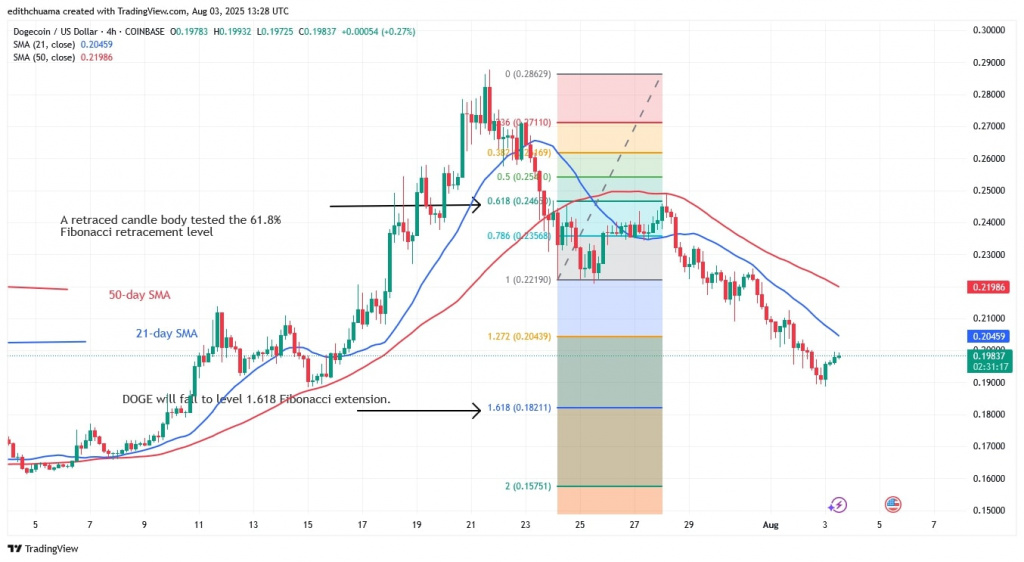
After the recent downturn, DOGE price bars have fallen below the moving average lines. However, the price of the cryptocurrency has risen above the 50-day SMA as buyers try to keep it above the moving average lines. On the 4-hour chart, the price bars are below the downward sloping moving average lines.
Technical indicators
Key Resistance Levels $0.45 and $0.50
Key Support Levels – $0.30 and $0.25

What is the next direction for DOGE?
DOGE has fallen below the moving average lines and has reached the expected price levels. On the 4-hour chart above, the altcoin is holding above the $0.19 level and has started an uptrend.
On the upside, DOGE will continue its uptrend if it rises above the moving averages. Otherwise, it will continue a sideways movement.

Coinidol.com wrote that DOGE rallied and broken through the $0.26 barrier to reach a high of $0.287, on July 27.
Disclaimer. This analysis and forecast are the personal opinions of the author. They are not a recommendation to buy or sell cryptocurrency and should not be viewed as an endorsement by CoinIdol.com. Readers should do their research before investing in funds.


