Ethereum’s price has entered a trading range after crossing the $4,000 mark.
Long-term analysis of the Ethereum price: fluctuating
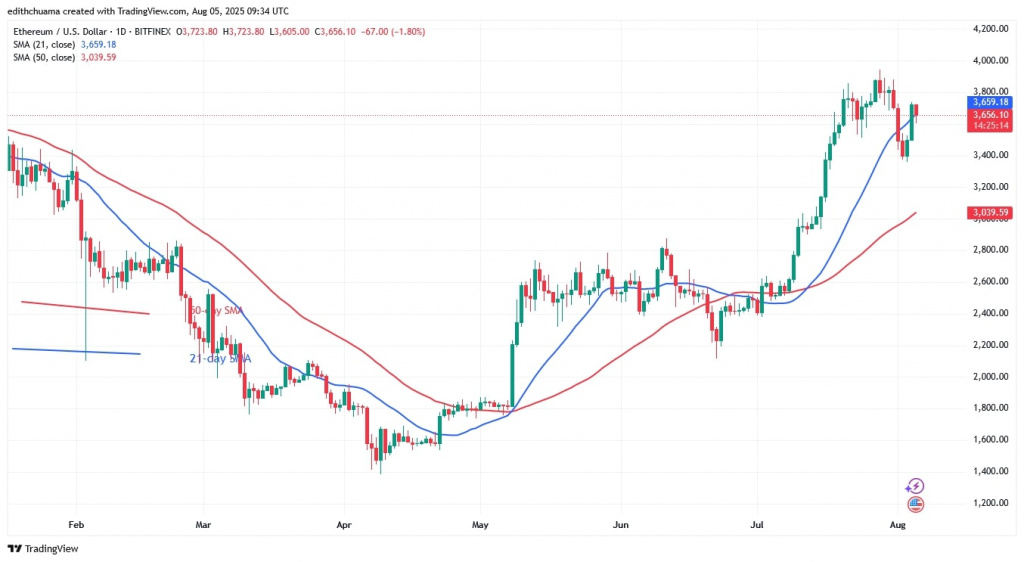
The largest altcoin initially fell above the $3,400 mark, but the bulls took advantage of the price dips, as reported previously. The altcoin is now trading above the $3,400 support and below the $4,000 resistance.
Ether is falling as the uptrend hits a first hurdle at $3,800. Should the bears break through the current support at $3,400, the altcoin will fall to its low at $3,000.
However, a break below the 50-day SMA support or the $3,000 low will send the altcoin lower still, to a low of $2,300. In the meantime, Ether is trading between moving average lines after a recent dip. At the time of writing, Ether is trading at $3,624.
Ethereum indicator analysis
The price of the cryptocurrency is trading between the moving average lines, with the bears having broken below the 21-day SMA twice. Despite the recent decline, the moving average lines are sloping upwards.
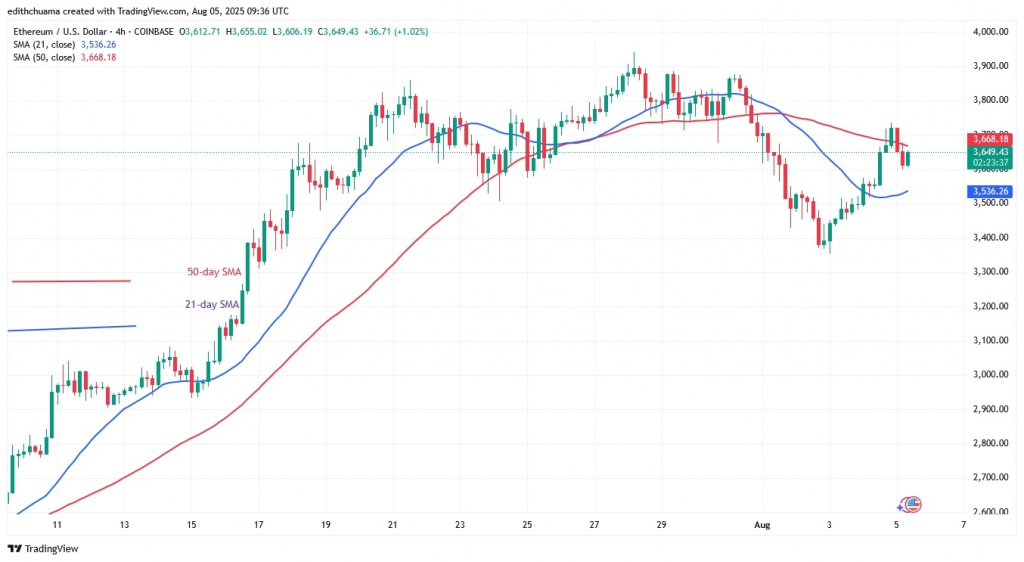
On the 4-hour chart (second chart), the moving average lines are horizontal, which indicates a sideways movement of the cryptocurrency. Doji candlesticks have appeared, causing the altcoin to stagnate.
Technical Indicators:
Key Resistance Levels – $4,000 and $4,500
Key Support Levels – $2.000 and $1,500

What is the next direction for Ethereum?
Ethereum is trading sideways, above the $3,400 support but below the $4,000 high. Ether is falling as it approaches the current support of $3,400. Doji candlesticks have returned as Ether maintains its rangebound move above the current support. Cryptocurrency price bars are trapped between moving average lines, resulting in a rangebound move.

Disclaimer. This analysis and forecast are the personal opinions of the author. They are not a recommendation to buy or sell cryptocurrency and should not be viewed as an endorsement by CoinIdol.com. Readers should do their research before investing in funds.


