Litecoin (LTC) prices have come under selling pressure again after peaking at $122.
Litecoin price long-term prediction: bearish
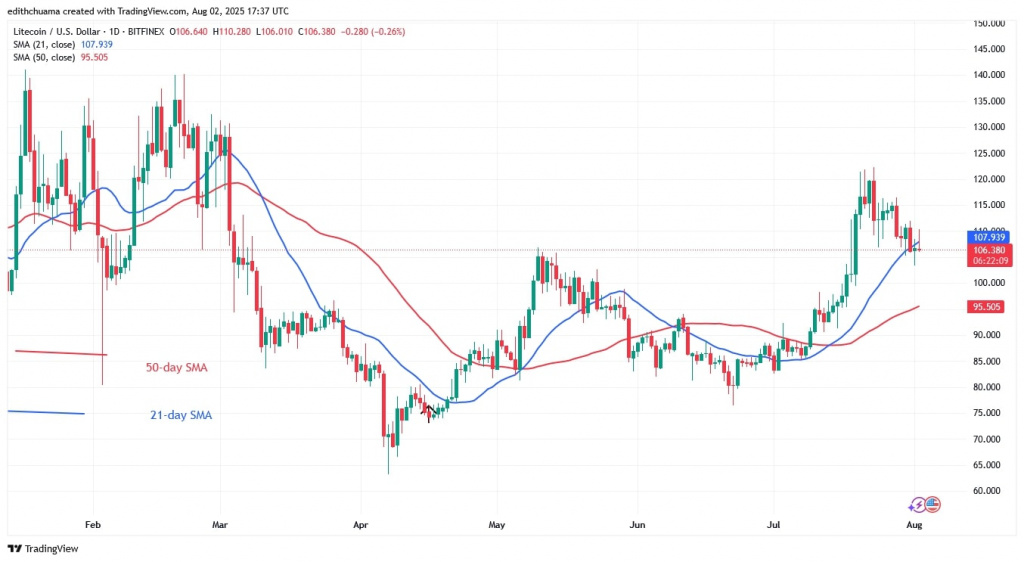
Bearish momentum has broken through the 21-day SMA support and effectively ended the uptrend. The LTC price plunged and stalled above the $102 support. The cryptocurrency is currently trading above the 50-day SMA support but below the 21-day SMA barrier.
Litecoin is expected to continue its negative trend if it falls below the 21-day SMA support. The downtrend will continue to the low at $95.51 or the 50-day SMA. In the meantime, the cryptocurrency is trapped between the moving average lines. Litecoin is now at $106.
LTC price indicators analysis
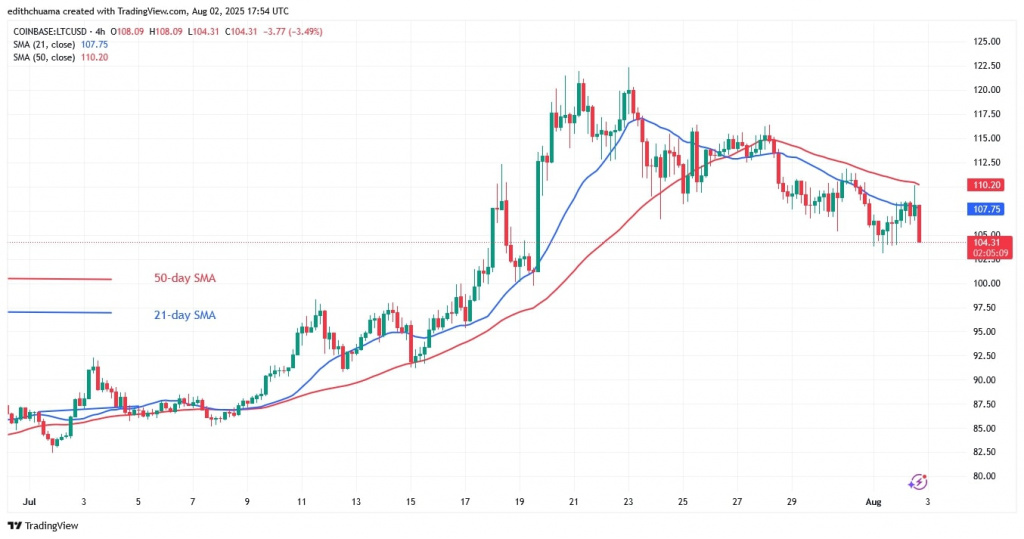
The altcoin’s negative momentum has caused it to fall below the 21-day SMA but above the 50-day SMA support. The moving average lines are sloping upwards, indicating a preceding positive trend. The price bars are between the moving average lines, so it will move in a range. On the 4-hour chart, the moving average lines are sloping downwards, indicating the current trend.
Technical Indicators
Resistance Levels: $100, $120, $140
Support Levels: $60, $40, $20

What is the next move for Litecoin?
Litecoin is in a negative trend after falling below the 21-day SMA support on the daily chart.
On the 4-hour chart below, the altcoin has stopped above the current level of $104. The price of the cryptocurrency has been trading above $104 but below the 21-day SMA. The 21-day SMA barrier has hindered the upward movement. The selling pressure will return if the altcoin turns down from the 21-day SMA barrier and the $104 support level.

Coinidol.com wrote last week that, Litecoin has been trading above the $108 support but below the $120 level.
Disclaimer. This analysis and forecast are the personal opinions of the author. They are not a recommendation to buy or sell cryptocurrency and should not be viewed as an endorsement by CoinIdol.com. Readers should do their research before investing in funds.


