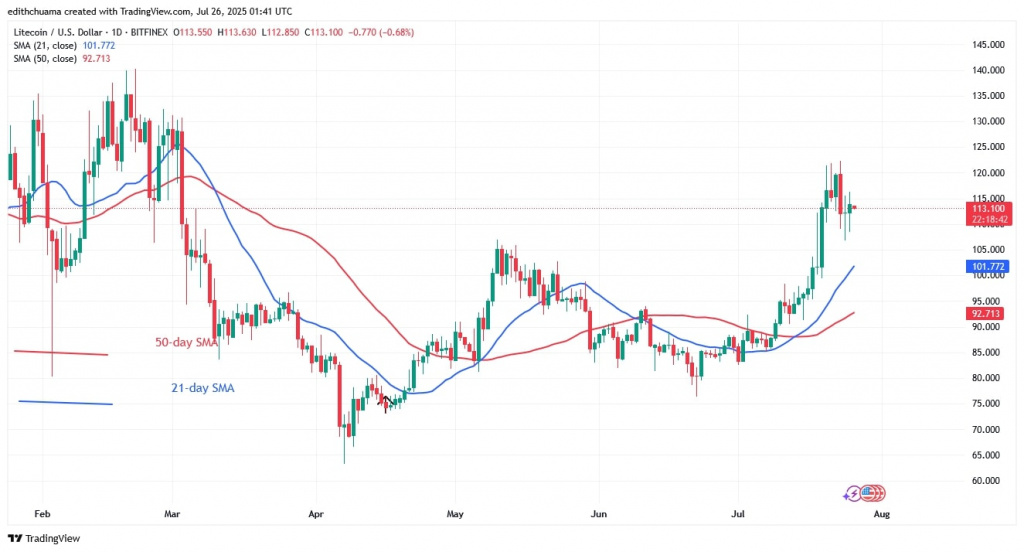
Litecoin (LTC) reached a high of $122 on July 23. The uptrend was halted at the current high and the altcoin is trading below the $120 mark.
Litecoin price long-term prediction: bullish
Over the past three days, Litecoin has been trading above the $108 support but below the $120 level. On the upside, if buyers break through the $120 level, the altcoin will rise to a high of $134. The cryptocurrency will return to its previous highs of $140 and $147.
On the downside, LTC price will come under renewed selling pressure if it falls back below the breakout level and the 21-day SMA support. The altcoin will fall back to $92, or a low of $88. Litecoin is currently trading at $113.
LTC price indicators analysis
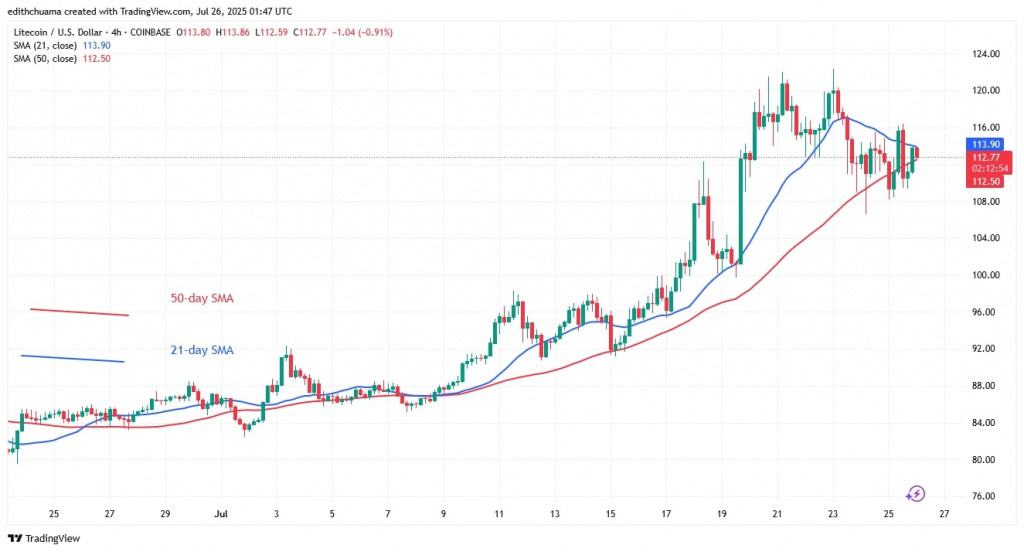
The horizontal moving average lines are sloping upwards, indicating an uptrend. The 21-day SMA has crossed above the 50-day SMA, signalling an uptrend. On the 4-hour chart, the moving average lines have a horizontal slope, signalling a sideways trend.
Technical Indicators
Resistance Levels: $100, $120, $140
Support Levels: $60, $40, $20

What is the next move for LTC?
Litecoin is approaching its historical price of $147. On the 4-hour chart, the altcoin is trading in a narrow range between $108 and $120 and thus below the barrier. Litecoin has dipped above the $108 mark but is still oscillating above it.
The uptrend will continue if the current support holds. Otherwise, selling pressure will start below the current support.

Disclaimer. This analysis and forecast are the personal opinions of the author. They are not a recommendation to buy or sell cryptocurrency and should not be viewed as an endorsement by CoinIdol.com. Readers should do their research before investing in funds.


