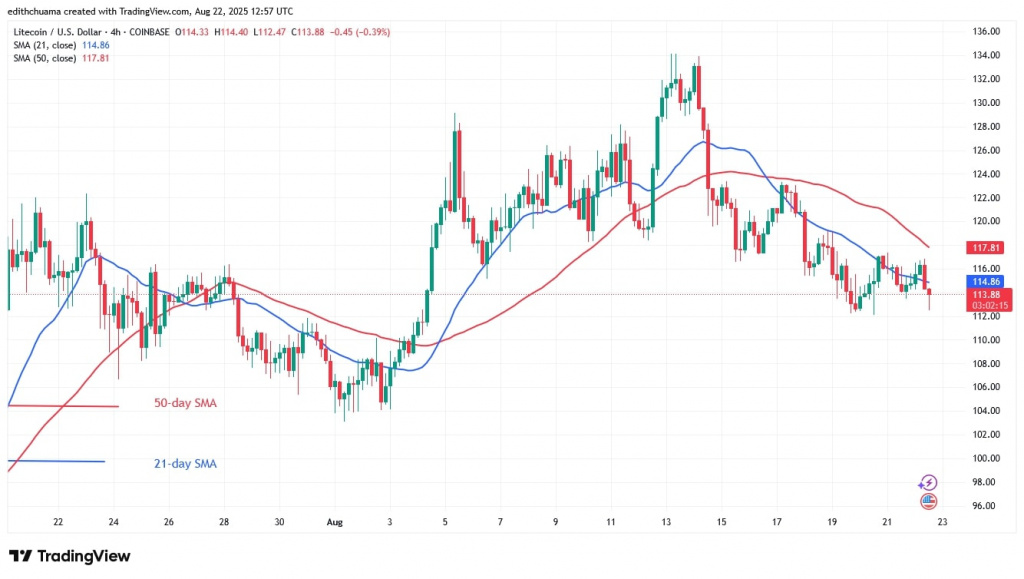
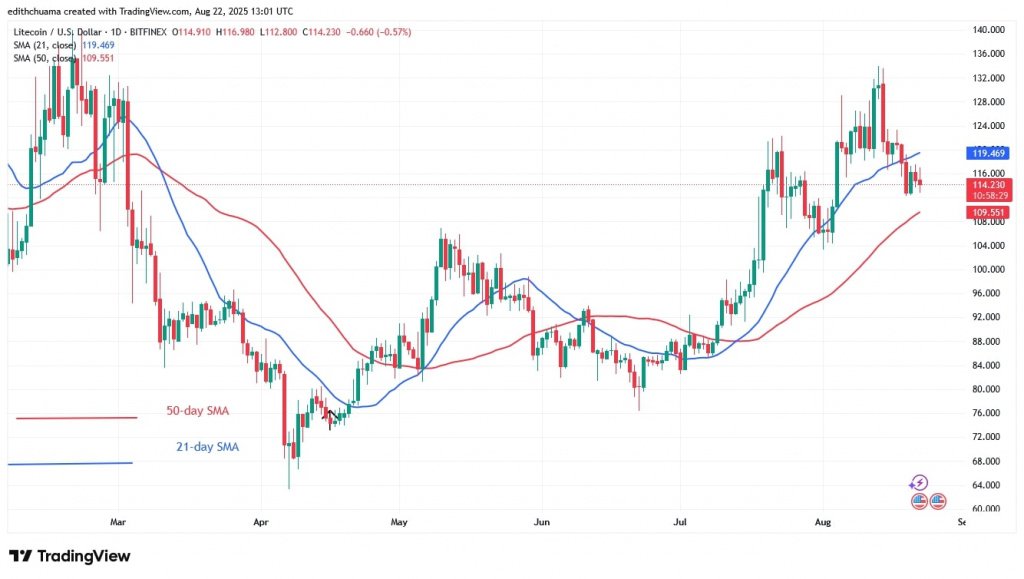
Litecoin (LTC) has fallen from its high of $133. Today, the altcoin has fallen to a low of $114, but is trading between the moving averages.
Litecoin price long-term prediction: bearish
LTC price is above the 50-day SMA but below the 21-day SMA and selling pressure is expected to remain on the downside. LTC will fall further to $106 if it falls below the 50-day SMA. So, it will have to move sideways between the moving average lines if the 50-day SMA holds as support. On the other hand, Litecoin will resume its uptrend if buyers keep the price above the 21-day SMA.
Litecoin price indicator analysis
Litecoin has been trading between the moving average lines for days now. The trend will continue if either the 21-day SMA barrier or the 50-day SMA support is broken. At the moment, the price is moving between the moving average lines.
On the 4-hour chart, the price bars are below the moving average lines, indicating that the price will continue to fall.
Technical Indicators
Resistance Levels: $100, $120, $140
Support Levels: $60, $40, $20

What is the next move for Litecoin?
Litecoin is falling below the moving average lines on the 4-hour chart (above). The cryptocurrency price is trading above the $112 support level but below the moving average lines.
On the downside, if the bears violate the $112 support level, the altcoin will fall to a low of $106. But Litecoin will gain if the altcoin recovers and crosses above the moving average lines.

Disclaimer. This analysis and forecast are the personal opinions of the author. They are not a recommendation to buy or sell cryptocurrency and should not be viewed as an endorsement by CoinIdol.com. Readers should do their research before investing in funds.


