

- Bitcoin price has fallen to $97,396, facing its first probable 3-day close under $100K in months as volume spikes 53%, showing intense sell pressure.
- A looming Death Cross, bearish oscillators, and a break of a key support point to a possible 9% slide toward the 200-day SMA at $87,000.
- Despite panic selling, record exchange outflows, and low liquidity, hints of a violent rebound once the correction exhausts.
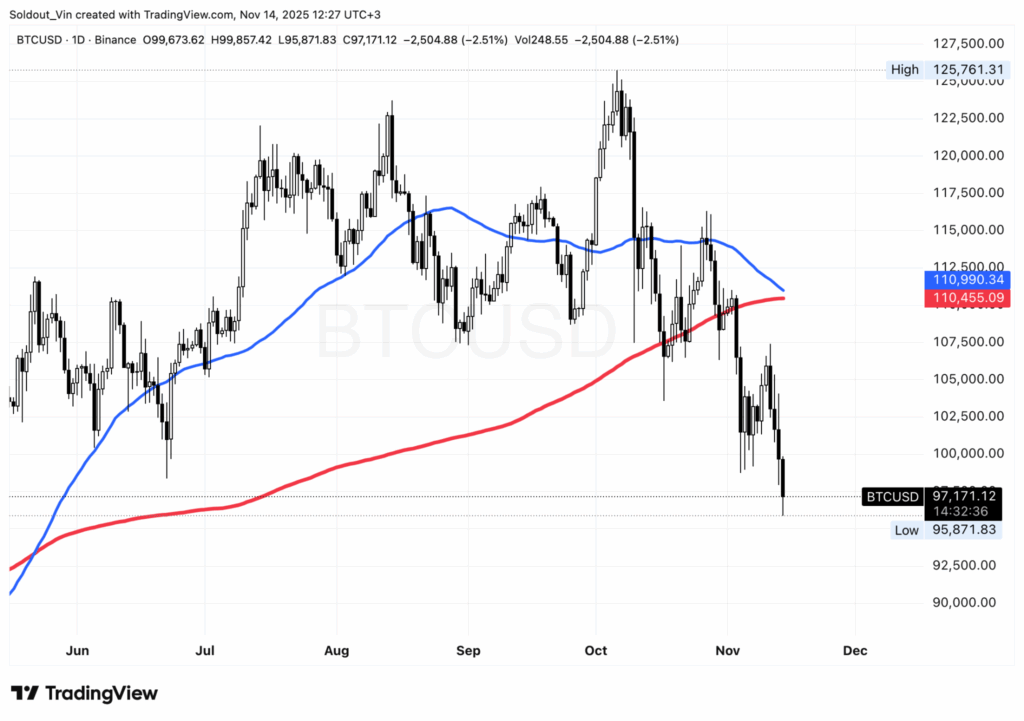
The Bitcoin price has dropped 5.2% in the last 24 hours to trade at $97,396, falling below $100K. This is the fourth time in the last 144 days that BTC has breached the $100K mark, and the first time it’s likely to close the 3-day candle below this crucial level.
With just 14 hours left to the close of the 3-Day candle, if a recovery doesn’t occur to push BTC back above $100K, the weekend might be devastating for the markets.
As of Friday, BTC traded at $97,396.19 amid a 53% surge in volume to $115 billion, signaling heavy selling pressure.
Bitcoin Price Braces for More Downside as Death Cross Looms
Technical indicators paint a grim picture. The cryptocurrency could extend its slide by another 9%, targeting $87,000, which aligns with the 200-day Simple Moving Average (SMA) on the 3D chart. Dropping to this level would erase much of the post-election optimism fueled by pro-crypto policies.
The attached chart, spanning November 2024 to March 2026, shows the bearish momentum. BTC’s price action shows a decisive break below the $100,653 horizontal support, with the 50-day simple moving average (SMA) at $112,754.81 acting as a formidable ceiling.
The 200-day SMA, hovering at $87,246.00, now looms as potential downside support—but historical patterns suggest it may not hold. A downward-sloping red trendline from the November 2025 peak reinforces this, projecting a retest of $90,000 en route to $87,000 if momentum persists.
Divergences in Oscillators Amplify Alarm
The Relative Strength Index (RSI) has dropped to 35.5, dipping into oversold territory and flashing a classic sell signal after weeks of overbought readings above 70.
Meanwhile, the MACD histogram bars have flipped deeply negative at -1,291, with the signal line crossing bearishly below zero, confirming a “Death Cross” setup on the daily timeframe.
This convergence of moving averages, where the shorter-term SMA slices under the longer-term, has historically marked local bottoms, but trader Ardi warned on X that failure to bounce here could validate further downside to $92,000 or lower, filling fair value gaps (FVGs) on the CME futures chart.
Volume Profile Reveals Capitulation
The latest session’s $2.6 billion (0.68%) drop in open interest hints at leveraged positions unwinding, exacerbating the 6% intraday wick to $95,130.70.
Yet, beneath the panic, mixed signals emerge. On-chain metrics show resilience, with over 800,000 BTC having exited exchanges in the past year, including 118,000 in the last 30 days, tightening supply and priming a “violent” rebound once selling exhausts.
Simply Bitcoin highlighted this outflow, noting only 11% of supply remains liquid, a classic illiquidity coil that could snap higher post-correction.
Contrasting Views Add Intrigue
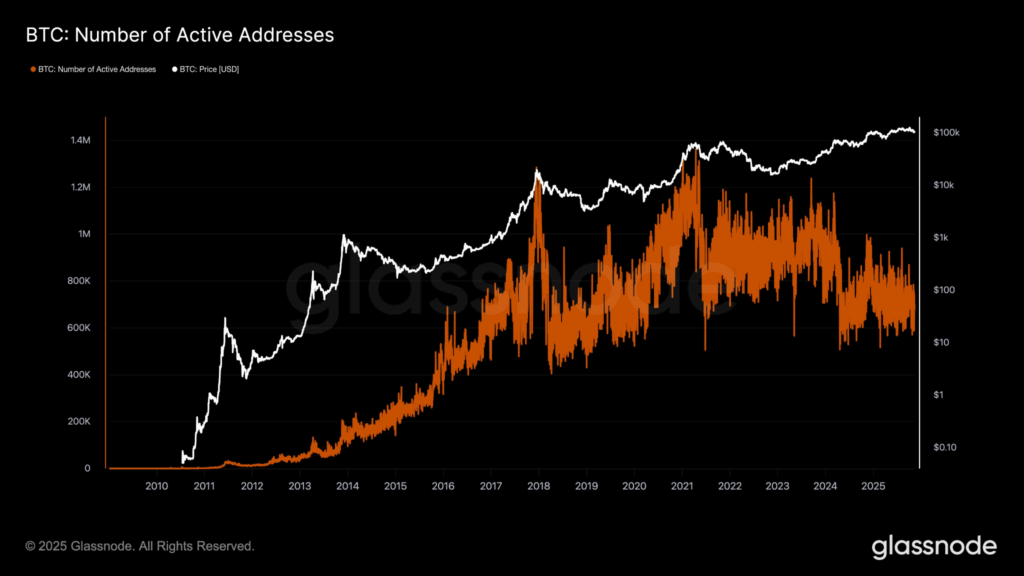
There is a widening gap between BTC price and active addresses, with wallet activity far from all-time highs, suggesting the bull cycle’s top “is not in yet.” This maturation as a store-of-value asset supports accumulation at these levels, potentially capping the crash.
Market sentiment teeters on a knife-edge. ETF inflows slowed to $200 million last week, per Bloomberg data, while U.S. Treasury yields spiking to 4.5% diverted capital to safer havens. If BTC holds $97,000, a relief rally to $102,000 is plausible, per Fibonacci retracements.
But a close below $95,000 could accelerate the 9% drop to $87,000, testing the 200-day SMA and shaking out weak hands.
For hodlers, this dip echoes 2021’s mid-cycle flush: painful but foundational. With halving scars fading and institutional bets piling in, the $87,000 abyss may prove a launchpad—or a black hole.
Disclaimer: The facts and analysis presented here are only for informational purposes. Readers should not interpret the content of this article as financial advice or product recommendations.
What’s your Reaction?
+1
0

+1
0

+1
0

+1
0

+1
0

+1
0

+1
2


