

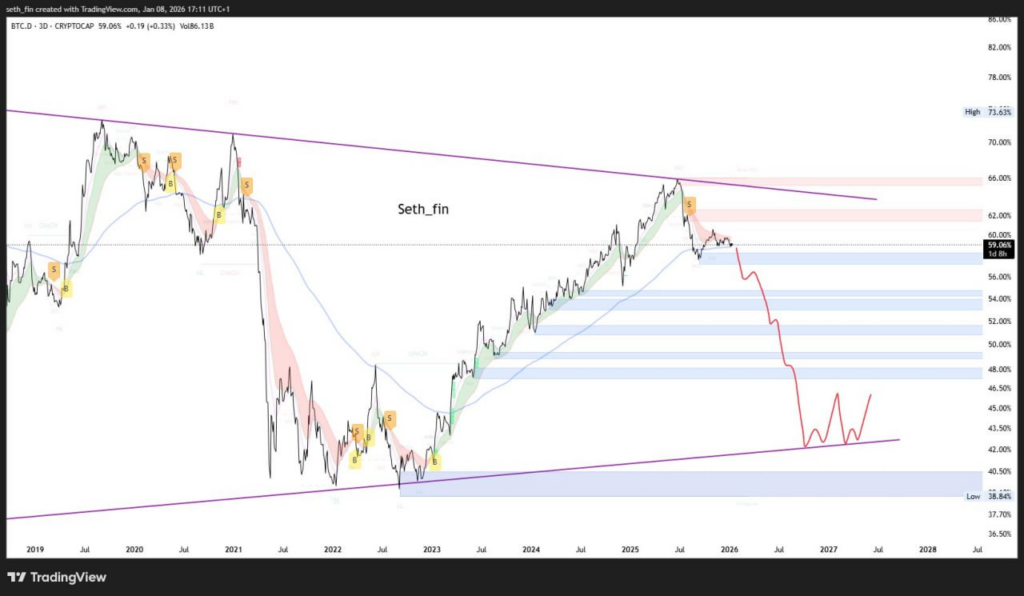
- Bitcoin dominance faces repeated rejection at the resistance signals capital rotation into altcoins.
- Markets now price a 93% chance of no Fed rate change in January, signaling macro stability.
- Glassnode metrics show short-term holder losses similar to past cycle lows, favoring accumulation over distribution.
As of January 9, 2026, Bitcoin trades near $98,800, down slightly on the day, while market participants digest mixed signals on macro conditions, Bitcoin dominance, and on-chain holder behavior.
Fed Rate Cut Odds Collapse
Polymarket data shows the probability of a 25 basis-point Federal Reserve rate cut in January has fallen to just 7%, down sharply in recent weeks.
The overwhelming consensus now favors no change at 93%, with a 50+ bps cut priced at 1% and any rate increase below 1%.
Lower odds of near-term easing reflect persistent inflation concerns. Meanwhile, resilient economic data reduces the likelihood of immediate liquidity boosts for risk assets like crypto.
Bitcoin Dominance Shows Sell Signals
Bitcoin dominance (BTC.D) edged up 0.19% today to around 58.94%, but technical indicators flash caution. The chart reveals two clear rejections at a descending resistance cloud on the 3-day timeframe, with a fresh sell signal already triggered.
Analysts note a similar setup preceded major dominance drops in prior cycles. A breakdown here would signal capital rotating out of Bitcoin and into altcoins, setting the stage for alt outperformance.
Meanwhile, Glassnode’s long- and short-term holder profit/loss metric shows periods of realized losses (circled in green) that historically marked cycle lows rather than tops.
Current readings resemble the capitulation phases of 2018, 2020, and 2022, not the euphoric profit-taking seen at market peaks. Long-term holders remain largely in profit, while short-term holders absorb losses, a pattern consistent with accumulation rather than distribution.
Technical Outlook: Bitcoin Price Action Points to Potential Upside
The latest Binance BTC/USDT daily chart shows price consolidating within a multi-month descending channel. Bitcoin recently bounced from channel support near $90,000 and now tests the midpoint around $98,000–$100,000.
The 50-day SMA sits at $89,287 (supportive), while the 200-day SMA at $106,398 acts as overhead resistance; the price remains below it, confirming the longer-term downtrend. RSI reads a neutral 50.93, and MACD lines are flattening near zero, suggesting momentum is stabilizing.
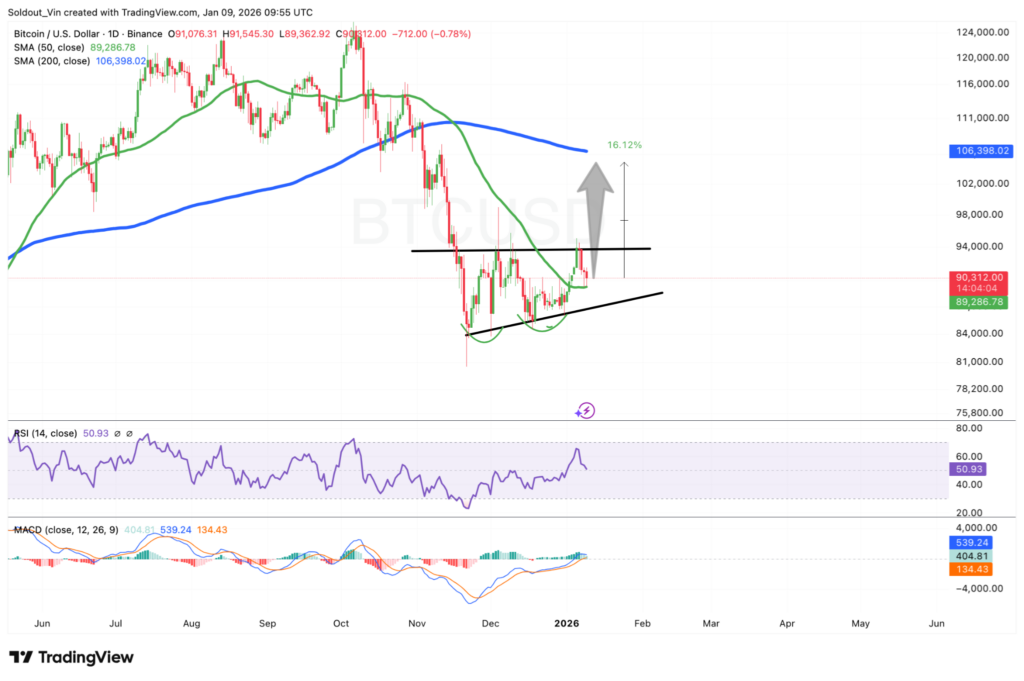
A large upward arrow on the chart points to a possible breakout above the channel and 200-day SMA toward $106,000–$110,000 if buyers step in. Failure to hold channel support risks a retest of $90,000 or lower.
Overall, the markets have priced in steady Fed policy, as Bitcoin dominance faces downside risk, and on-chain data leans constructive.
While short-term caution remains with price below the 200-day moving average, the weight of evidence, capitulation-like holder losses, dominance sell signals, and channel support, suggests this consolidation resembles a cycle bottom more than a top. Altcoins stand to benefit most if Bitcoin dominance rolls over as expected.
What’s your Reaction?
+1
3

+1
0

+1
0

+1
0

+1
0

+1
0

+1
0


