

- Despite a 2.1% daily dip in Bitcoin price, BTC saw $241 million in ETF inflows, led by BlackRock.
- Technicals suggest a possible 32% rally in October, with Bitcoin trading above key SMAs.
- Morgan Stanley’s upcoming BTC offering and policy proposals for 401(k) crypto exposure could bring massive capital inflows into the market.
The Bitcoin price has dropped 2.1% in the last 24 hours, trading at $109,285 as of 2:07 a.m. EST, following a 39% surge in trading volume to $68 billion. This price drop occurs despite ETFs recording inflows after a couple of days of outflows, which has instilled fear in the market. Is the BTC downtrend done?
Renewed ETF Appetite Sees $241M Inflows In 24 Hours
On September 24, U.S. spot Bitcoin funds saw $241 million in net inflows, the first positive day after two outflows. The resurgence was led by BlackRock’s iBIT, which recorded $129 million.
No ETF reported a net exit, a stark reversal. Ethereum funds, meanwhile, lost $79 million, underscoring Bitcoin’s edge.
Bigger waves are coming as Morgan Stanley, managing $1.7 trillion, plans to offer Bitcoin trading on its E*TRADE platform next year, potentially opening doors for 10 million customers.
Meanwhile, lawmakers are pushing the SEC to greenlight Trump’s executive order, letting Americans park 401(k) savings, which could see over $9 trillion total flooding into crypto.
Moreover, the revised Q2 GDP growth to 3.8% signals a substantial U.S. expansion, a tailwind for risk assets like Bitcoin, which serves as a hedge against economic uncertainty.
Bitcoin Price Could Jump to $146,000 By the First Week of October
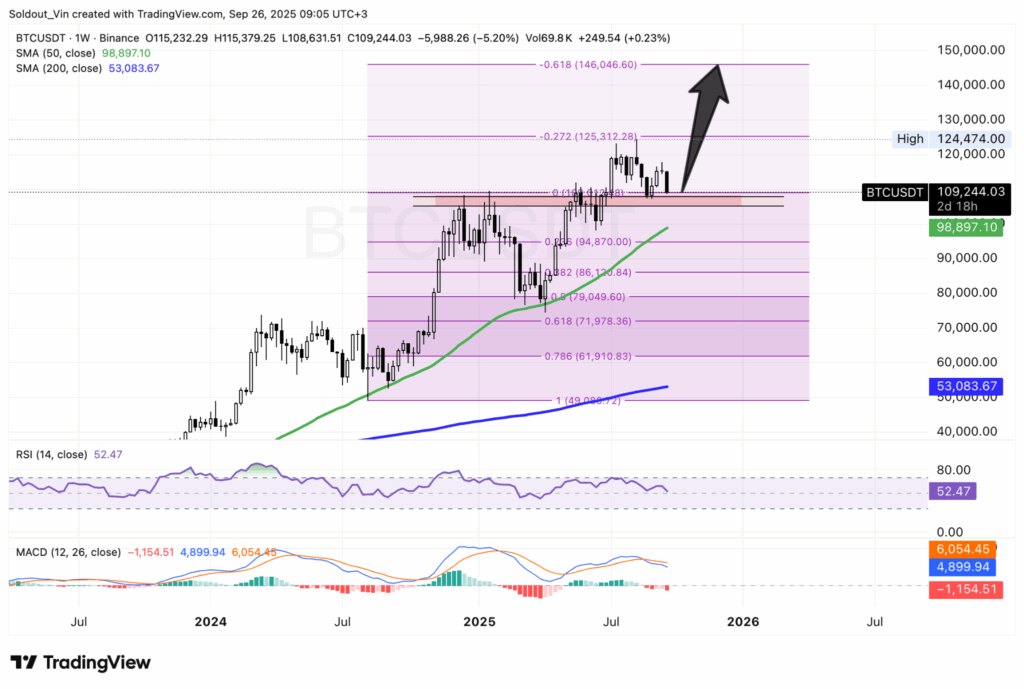
Bitcoin price is holding steady around $110,000 as September wraps up, but eyes are on a potential breakout next month. Technical analysis suggests a potential 32% surge to approximately $150,000 by mid-October, driven by new inflows into spot ETFs and significant institutional investment. With the crypto king trading above key long-term averages, the setup appears ripe for upside if momentum continues to build.
The BTC/USDT weekly chart shows the price dipping recently to around $74,700 in early April before bouncing back to establish a new all-time high of $124,474 four months later.
The 50-day simple moving average (SMA) is currently at $98,971, just above the current levels, signaling short-term support. More bullish is the fact that Bitcoin remains well above both the 50 and 200-day SMA ($53,084), indicating a solid uptrend since mid-2024.
Momentum Indicators Suggest Bearish Trend Not Over
Technical indicators are mixed but leaning more towards negative, despite the positive institutional interest via ETFs. The Relative Strength Index (RSI) reads 52.47, indicating a neutral territory, neither overbought nor oversold, leaving room for gains without exhaustion.
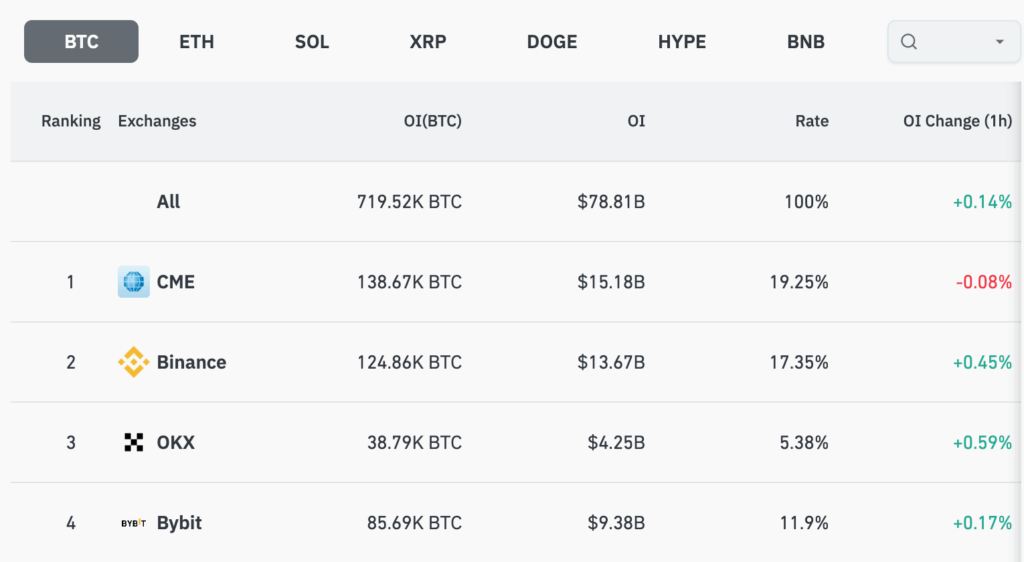
However, it is still facing down, signaling that selling pressure on BTC is increasing, which can be confirmed by the 39% surge in Open Interest among the four largest BTC-traded platforms. Overall, the BTC Open Interest rose by 0.14% to $78.81 billion, per data from Coinglass
Rising volume with dropping prices may signal increased bearish intent among traders.
The Moving Average Convergence Divergence (MACD) also tells a cautious tale, with the line at -1,154 and a bearish crossover. However, the histogram’s green bars suggest fading selling pressure.
If BTC price holds above $110,000, the next target would be the previous ATH at $124,000. Beyond that, the Bitcoin price may soar to the 0.618 Fibonacci extension, around $146,000, representing a 32% run from here.
Conversely, if bears push the price down, BTC may find support around the 50-day SMA at $98,900.
Predictions from an ambitious Chamath Palihapitiya lock in targets at $500,000 by month’s end, while more conservative projections from CoinGecko cluster at $180,000 for 2025, with 42% odds of $124,000 being the cycle peak. SEC delays on other crypto ETFs until late October add intrigue.
For everyday investors, this means opportunity amid caution. Bitcoin’s chart whispers recovery; ETF flows shout adoption. October could deliver that 32% pop if bulls charge.
Disclaimer: The facts and analysis presented here are only for informational purposes. Readers should not interpret the content of this article as financial advice or product recommendations.
What’s your Reaction?
+1
0

+1
0

+1
1

+1
0

+1
0

+1
0

+1
0


